Heat Vulnerability Map and Cooling Solutions Webtool
Example hero paragraph text.
Heat Vulnerability Map
The Heat Vulnerability Map and Cool Solutions Webtool is a research project transformed into a public good everyone can access.
It helps to prioritize investments in cooling infrastructure in high heat vulnerability areas in Maricopa County communities.
The Heat Vulnerability Map and Cooling Solutions tool has two action areas. The interactive heat map is a dashboard that allows exploring which parts of the city are highly exposed to heat and who is most vulnerable in these areas: Visit Interactive Heat Vulnerability Map
The cooling solutions tab offers research-based approaches to address heat vulnerability: Visit Cooling Solutions to Heat Vulnerability
The Heat Vulnerability Map and Cooling Solutions tool facilitates dialogue on equitable investments in cooling infrastructures that benefit heat-vulnerable groups and places. The goal is to create a better lived experience for people bearing the brunt of heat now and into the future in Maricopa County.
The experience of creating the tool showed how the interactive heat map inspires conversations, motivates collective action and cooperative planning across municipal boundaries and with developers. To build urgently needed heat mitigation measures into local and regional projects, the tool provides the necessary elements:
- heat data across scales (ranging from the site-, neighborhood-, city- and regional scales);
- vulnerability data for each census tract in Maricopa County;
- place-based data on conditions, nuisances and assets in neighborhoods;
- information on research-based cooling solutions that could be transferred and adapted to specific locations to cool an area and do so in equitable ways.
Pedestrian and bike-pathways solutions: Sonoran Roots student landscape architecture design and illustrations by: Kyla Daniel, Keinen Davis, Jocelyn Dominguez, Sam Najera.
Regional collaboration is central to equitable urban cooling as people live, work, and play in various places. A regional collaboration approach facilitates heat equity solutions in areas like
- Transit and mobility
- Pedestrian and bike-pathways
- Water management
- Air Conditioning Affordability
The Heat Vulnerability Map Helps Your Equity Work
The heat vulnerability map provides data to create holistic projects involving various departments and regional partners for your equity work. With the tool, you can:
- Spatially identify and zoom into these areas to show the statistics characterizing affected groups and associated vulnerabilities, based on CDC data, as well as the amenities and nuisances;
- Use the tool to increase dialogue and exchange information;
- Include this map into federal grant applications to demonstrate how your project ensures Justice40 requirements by investing into marginalized areas to benefit underrepresented groups;
- deconstruct structural racism manifesting in redlining and, by selecting and implementing equitable projects, move towards restorative justice and regenerative economic solutions.
Everyone can make a contribution to heat mitigation. By understanding heat exposure through the lens of vulnerability data, the tool helps develop a practice of equitable urban cooling, i.e., identifying places with high vulnerability and heat exposure and investing into cooling infrastructures in these areas first and foremost. The tool leverages the power of collective efforts to ensure regional resilience as it helps recognize unique features of Maricopa County.
Use Cases
Video Explainers
Watch the short Video: Heat Vulnerability – What is it? to get a tour of the map and learn how you can use it for your own inquiries and to create your customized maps by
- exploring solutions to heat equity concerns, both hyper-locally and in a regional context
- using spatially explicit data in support of a regional application for federal funds
- discovering additional insights while answering your initial starting question
The videos below present use cases – explaining how an emergency manager, a youth coordinator and a student researcher use the tool for their work.
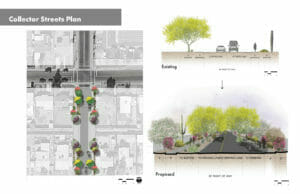
Example of a city planner
Example of a city planner, using the Heat Vulnerability Map to identify which streets have a low tree canopy, specifically in neighborhoods with high vulnerability as indicated through multi-unit structure housing and households in high land surface temperature conditions. The results inform future implementation of green infrastructure to support the city’s goals of being a “livable” city. Student landscape architecture design and illustrations by: Josie Barlay, Bella Dela Cruz, Roberto Lugo, Emily Singer, Alec Trevillian
Use Cases
User Guide
Choose Your Own Vulnerability Map Example
If you prefer to read instead of watching a video, you can also follow this step-by-step guide to identify heat vulnerabilities and associated cooling solutions. It starts with the key question: Where are the hottest areas in the Valley where people live under the poverty line or are unemployed?
To answer this question, go through the following steps:
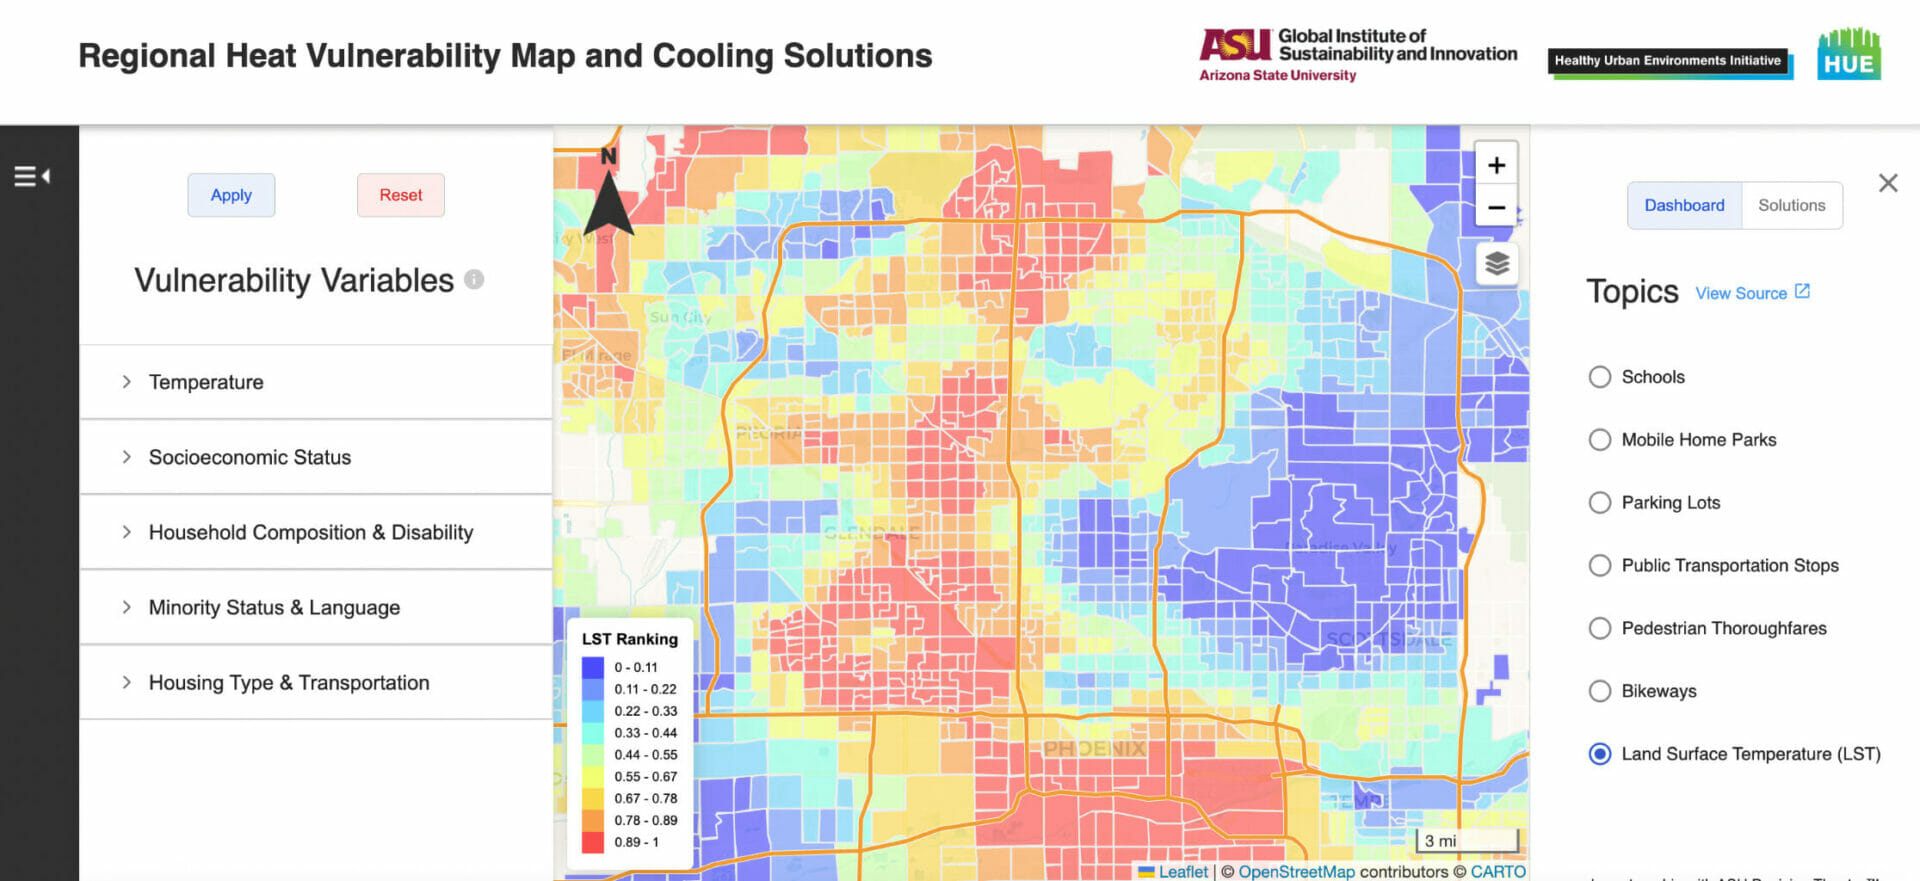
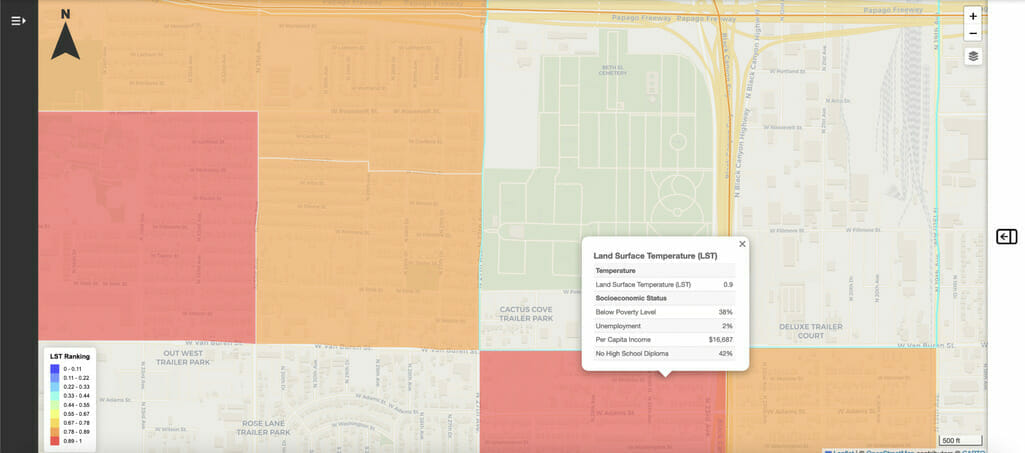
Step 1: Select vulnerability variables that relate to poverty and unemployment in Maricopa County.
Hit “Apply” to show the effect of your selection on the map (see picture below):
- 16-50% of people are living below poverty level,
- 0-12% of residents are unemployed
- X% of residents have a per capita income 0-17,073$ and
- have low chances of receiving a high school diploma.
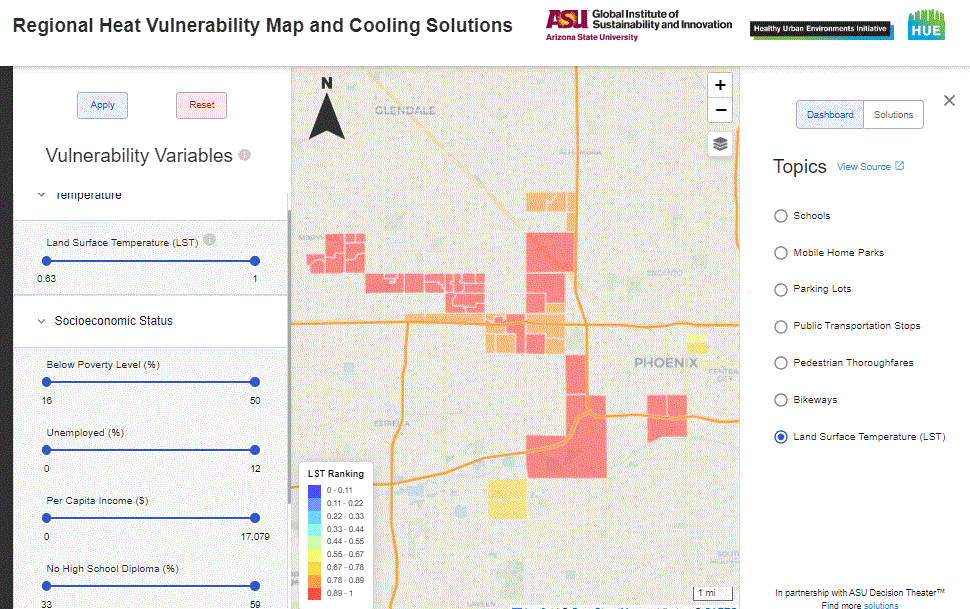
This map shows the areas shaded in orange, red and yellow are characterized by communities with the vulnerability variables listed on the left and experiencing high levels of heat as indicated in the legend titled “LST Ranking” (Land Surface Temperature Ranking).
Step 2: Analyze map and select solutions tab
We decided to zoom in along the intersection of Papago Freeway and Black Crain Highway around Bethel cemetery as the two surrounding communities have high Land Surface Temperatures temperatures (.84 – orange and .90 – red areas). The cemetery between the two neighborhoods stirs questions. For instance, does the cemetery contribute to the LST temperature difference and the pedestrian thoroughfares between the two?
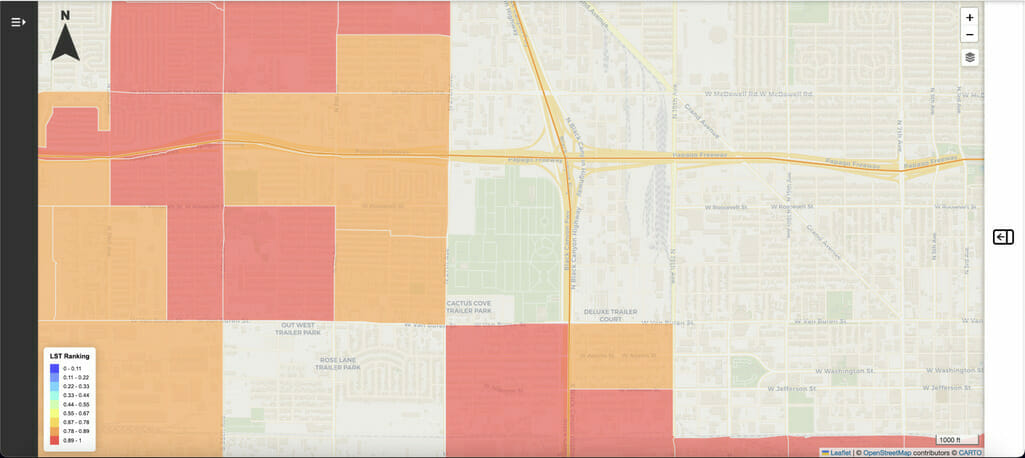
Zooming into the high Land Surface Temperatures temperatures at the intersection of Papago Freeway and Black Crain Highway around Bethel cemetery.
Zooming further into the area and showing the detailed statistics for a census tract.
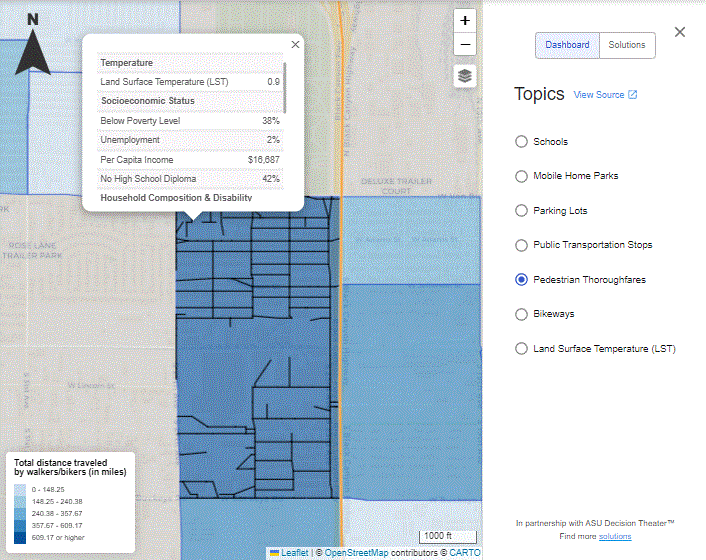
The Solutions Tab List (on the right) include applicable and existing infrastructure solutions and show specific locations on the map. We selected the pedestrian thoroughfares solution on the left and scroll down in the pop up box.
Step 3: View the socioeconomic status data
Reviewing the data in the popup box allows us to learn that residents living in this area are experiencing extremely high land surface temperatures (.90) as well as:
- 38% of residents live below the poverty line (Per Capita Income is $16,687)
- 42% of the residents do not have a high school diploma
- The pedestrian thoroughfares total traveled distance is 135.34 miles (lighter blue box) & 788.57 miles (darker blue box)
Step 4: Review example solutions to explore potential heat mitigation measures.
The residents living along the intersections of Papago Freeway and Black Crain Highway around Bethel cemetery might be in need to receive an increase in green canopy and cool infrastructures such as a cool corridor to improve their commute and overall quality of life in extreme temperatures. Other heat mitigation measures are listed on the right tab “Cooling Solutions”. The picture below presents an example of a “cool corridor” for future green infrastructure investments.
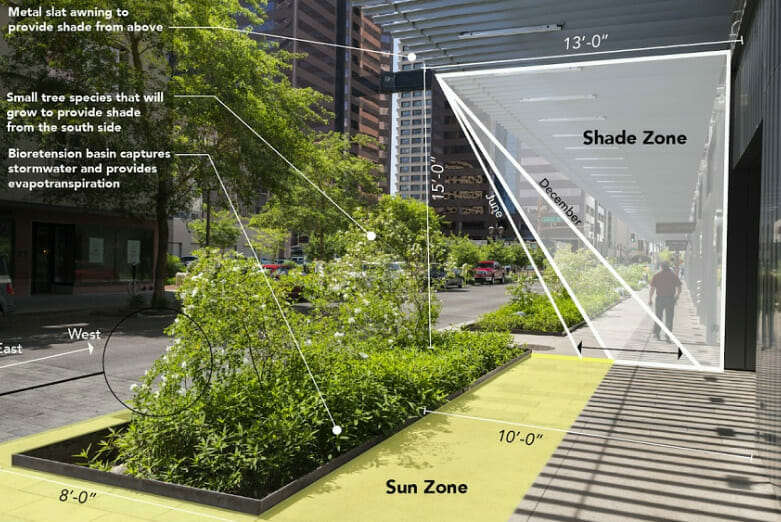
A possible type of Cool Corridors Infrastructure to improve personal cooling and overall experience in extreme heat conditions. Photograph and illustration by Paul Coseo from Heat Action Planning Guide (2019)
In conclusion, the Heat Vulnerability Map, showcasing place-based heat mitigation solutions in various locations across the region while providing regional views, helps identify where heat mitigation measures should be prioritized and what level of investment and prioritization would need to occur in the coming years.
Download the data to build your own analysis

Regional Heat Vulnerability Map and Cooling Solutions:
A web tool of the Healthy Urban Environments Initiative
As part of the open data initiative, you can download this data package on the “Regional Heat Vulnerability Map and Cooling Solutions: A webtool of the Healthy Urban Environments Initiative”, view its full metadata, and learn how to cite the data from the EDI Development Environment website.
Community-City-University Partnership
The Heat Vulnerability Map and Cool Solutions webtool was developed through the Community-City-University Partnership, spearheaded by the City of Tempe’s Office of Sustainability & Resilience and Arizona State University’s Herberger Institute for Design and the Arts and the School of Sustainability. community leaders, city planners and ASU faculty and students reviewed the work in progress and provided critical feedback in two workshops. Community members informed the development by sharing how they would use the tool and for what purposes. City staff from the Tempe and Phoenix shared how the tool can support planning processes as well as communication with developers and community outreach. Researchers from various ASU Colleges collaborated with the Healthy Urban Environment (HUE) Initiative to integrate the heat research developed over two funding periods. ASU’s Decision Theater created the actual map and the user interface.
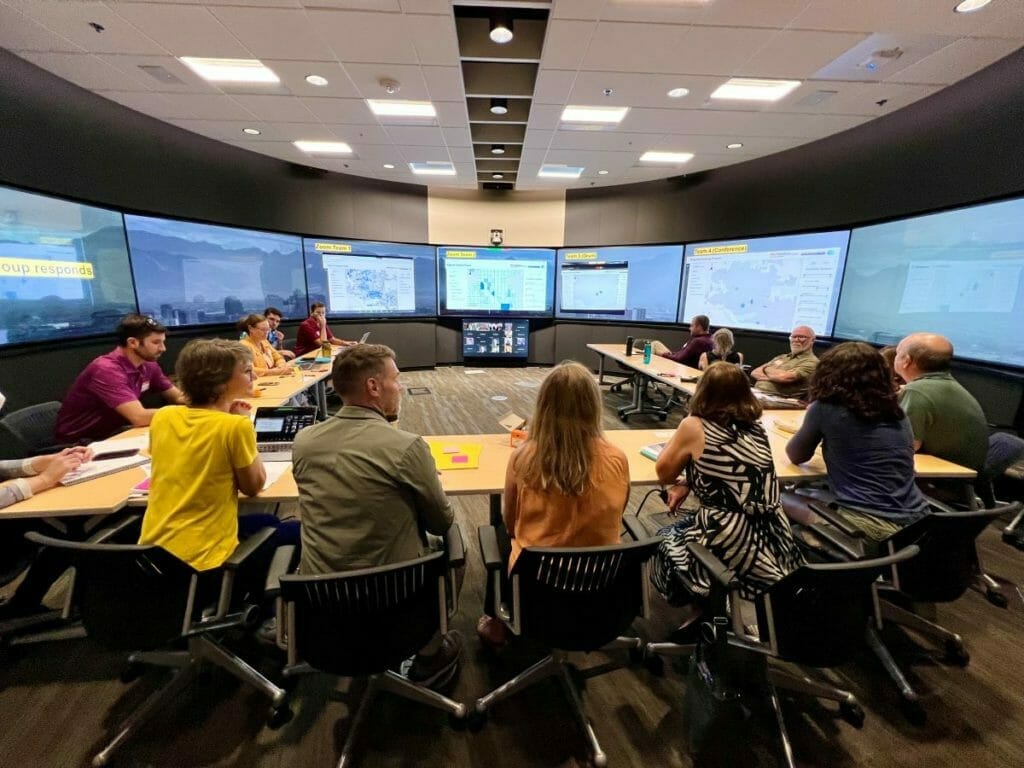

ASU’s Healthy Urban Environment (HUE) – Cool Kids Initiative team spring semester 2022, led by Paul Coseo, program head and associate professor at Herberger Institute for Design and the Arts and Katja Brundiers, clinical associate professor with the School of Sustainability. The team is supported through graduate student researchers. Photograph by Andy Delisle
As a Community-City-University partnership, the effort hopes to contribute to developing a regional approach to heat preparedness and mitigation that ultimately can support the co-creation of a Regional Cooling Authority. Such an authority could facilitate coordination of heat mitigation infrastructures and services provided by diverse organizations including NGOs, tribal nations, cities, and utilities as well as youth leadership. The synergetic goal is to deliver essential cooling services such as cooling centers, heat ready schools, as well as green stormwater infrastructure, and more, to communities in a regionally coordinated manner. Regional collaboration efforts to solve problems beyond the reach of any single entity are becoming more prevalent across the US.