Summary
One of CAP LTER’s core research aims is to predict and explain the outcomes of social-ecological processes through understanding of past and future urban environmental change, across space and time. Documenting the spatial heterogeneity of changes in landscape and bioclimatic characteristics is fundamental to conducting such analyses. Toward this end, CAP LTER researchers have long strived to produce diverse remotely sensed geospatial datasets that complement our long-term monitoring efforts, particularly through the generation of time series products of historical and contemporary land use/land cover change (LULCC) at multiple spatial resolutions (1-m, 30-m, and 250-m) across central Arizona-Phoenix. These LULLC datasets include: 1) 1-m resolution land-cover classifications for 2010 and 2015 using NAIP (National Agricultural Imagery Program) imagery (Li et al. 2014; Zhang and Li 2020); 2) 30-m resolution land-cover classifications for 1985, 1990, 1995, 2000, 2005, 2010, 2015 and 2020 based on Landsat imagery (Zhang and Li 2017; Sabu et al. 2023); 3) historical land-use classifications of central Arizona-Phoenix 1912 to 1995 (Moritz et al. 2016); and 4) 1-m resolution “open” or “vacant” land cover for 2010 and 2015 (Smith et al. 2017; Smith et al. 2020). Additionally, researchers have created a dataset identifying key features of central Arizona’s urban ecological infrastructure (UEI), including both built and natural features of the urban landscape fundamental to the provisioning of urban ecosystem services (Brown et al. 2021).
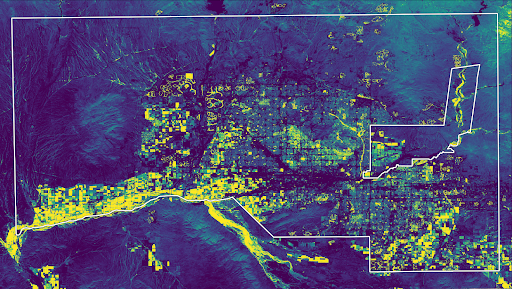
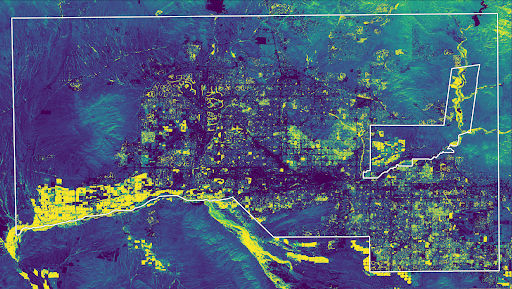
With the proliferation in publicly available satellite imagery, particularly through platforms such as Google Earth Engine, CAP researchers have produced additional geospatial datasets for characterizing long-term and seasonal dynamics of vegetation, impervious surface cover, land surface temperature, water, and climate. This includes multiple long-term datasets of vegetation greenness (as proxy measures of vegetation productivity): 1) 30-m resolution seasonal and annual estimates of vegetation greenness indices (NDVI) for 1998 to 2023, based on Landsat imagery (Haight et al. 2025a); 2) 250-m resolution annual estimates of vegetation (EVI) seasonality from 2001 to 2018, derived from MODIS imagery (Albuquerque 2020); and 3) 1-m resolution vegetation greenness estimates (NDVI, SAVI) for 2010, 2013, 2015, 2017, 2019, and 2021, based on NAIP imagery (Stulhmacher 2019a-h; Sabu and Frazier 2023a-d). To estimate variation in impervious surface area associated with urbanization, including the creation of buildings and roads, we have estimated a variety of impervious surface indices, including the Enhanced Normalized Difference Impervious Surface Index (1998 to 2023; Haight et al 2025b). Datasets of land surface temperature (LST) include 30-m resolution time series at 5-year intervals (1985 to 2020; Frazier et al. 2021) and 1-year intervals for multiple seasons (1998 to 2023; Haight et al. 2025c). To characterize the seasonally ephemeral distributions of arid streams and waterbodies, water indices have been produced at a 30-m resolution (Haight et al. 2024c). Lastly, datasets summarizing bioclimatic conditions (air temperature, precipitation, etc.) at a 1-km resolution have been produced across central Arizona, based on NASA Daymet data (Boehme et al. 2019; Haight et al. 2025c).
Datasets
Land use/land cover
- Land-cover mapping of the central Arizona region based on 2015 National Agriculture Imagery Program (NAIP) imagery
- CAP LTER land cover classification using 2010 National Agriculture Imagery Program (NAIP) Imagery ver 1. Environmental Data Initiative.
- Land use and land cover (LULC) classification of the CAP LTER study area (central Arizona, USA) using Landsat imagery: 2015 and 2020 [Dataset]. Environmental Data Initiative.
- Land cover classification of the CAP LTER study area at five-year intervals from 1985 to 2010 using Landsat imagery ver 1. Environmental Data Initiative.
- Landuse classification of central Arizona-Phoenix 1912 to 1995 ver 11. Environmental Data Initiative.
- Land cover classification of central Arizona-Phoenix using Landsat Enhanced Thematic Mapper (ETM) data, year 2005 ver 9. Environmental Data Initiative.
- Urban Ecological Infrastructure (UEI) in the greater Phoenix, Arizona metropolitan area and surrounding Sonoran desert region (2010-2017) ver 1. Environmental Data Initiative.
Impervious surface
- Long-term composited Enhanced Normalized Difference Impervious Surface Index (ENDISI) for the greater Phoenix, Arizona, USA, metropolitan area and the surrounding Sonoran desert derived from annual and seasonal Landsat imagery, 1998 to 2023 ver 2. Environmental Data Initiative.
- Long-term composited and land cover-adjusted Enhanced Normalized Difference Impervious Surface Index (ENDISI) for the greater Phoenix, Arizona, USA, metropolitan area and the surrounding Sonoran desert derived from annual and seasonal Landsat imagery, 1998 to 2020 ver 1. Environmental Data Initiative.
Vegetation
- Long-term composited Normalized Difference Vegetation Index (NDVI) for the greater Phoenix, Arizona, USA, metropolitan area and the surrounding Sonoran desert derived from annual and seasonal Landsat imagery, 1998 to 2023 ver 1. Environmental Data Initiative.
- Annual seasonality trends of Enhanced Vegetation Index (EVI), Maricopa County, Arizona, 2001-2018 ver 2. Environmental Data Initiative.
- Normalized Difference Vegetation Index (NDVI) derived from 2021 National Agriculture Imagery Program (NAIP) data for the central Arizona region ver 1. Environmental Data Initiative.
- Soil-Adjusted Vegetation Index (SAVI) derived from 2021 National Agriculture Imagery Program (NAIP) data for the central Arizona region ver 1. Environmental Data Initiative.
- Normalized Difference Vegetation Index (NDVI) derived from 2019 National Agriculture Imagery Program (NAIP) data for the central Arizona region ver 2. Environmental Data Initiative.
- Soil-Adjusted Vegetation Index (SAVI) derived from 2019 National Agriculture Imagery Program (NAIP) data for the central Arizona region ver 2. Environmental Data Initiative.
- Normalized Difference Vegetation Index (NDVI) derived from 2017 National Agriculture Imagery Program (NAIP) data for the central Arizona region ver 2. Environmental Data Initiative.
- Soil-Adjusted Vegetation Index (SAVI) derived from 2017 National Agriculture Imagery Program (NAIP) data for the central Arizona region ver 2. Environmental Data Initiative.
- Normalized Difference Vegetation Index (NDVI) derived from 2015 National Agriculture Imagery Program (NAIP) data for the central Arizona region ver 2. Environmental Data Initiative.
- Soil-Adjusted Vegetation Index (SAVI) derived from 2015 National Agriculture Imagery Program (NAIP) data for the central Arizona region ver 2. Environmental Data Initiative.
- Normalized Difference Vegetation Index (NDVI) derived from 2013 National Agriculture Imagery Program (NAIP) data for the central Arizona region ver 2. Environmental Data Initiative.
- Soil-Adjusted Vegetation Index (SAVI) derived from 2013 National Agriculture Imagery Program (NAIP) data for the central Arizona region ver 2. Environmental Data Initiative.
- Normalized Difference Vegetation Index (NDVI) derived from 2010 National Agriculture Imagery Program (NAIP) data for the central Arizona region ver 2. Environmental Data Initiative.
- Soil-Adjusted Vegetation Index (SAVI) derived from 2010 National Agriculture Imagery Program (NAIP) data for the central Arizona region ver 2. Environmental Data Initiative.
Water
Land surface temperature and climate
- Long-term seasonally and annually aggregated climatic variables for the greater Phoenix, Arizona, USA, metropolitan area and the surrounding Sonoran desert, derived from single-day NASA Daymet images, 2000 to 2022 [Dataset]. Environmental Data Initiative.
- Long-term composited land surface temperature for the greater Phoenix, Arizona, USA, metropolitan area and the surrounding Sonoran desert derived from annual and seasonal Landsat imagery, 1998 to 2023 ver 1. Environmental Data Initiative.
- Composited land surface temperature of the greater Phoenix, Arizona, USA metropolitan area and surrounding Sonoran desert derived from cloud-free, summer (June, July, and August) Landsat imagery: 1985-2020 ver 2. Environmental Data Initiative.
- Climactic data derived from remotely sensed, daily weather parameters (NASA DAYMET): Maricopa County, AZ (2000-2016) ver 1. Environmental Data Initiative.
Publications
- Baker, L.A., A.J. Brazel, N.J. Selover, C.A. Martin, N.E. McIntyre, F.R. Steiner, A.L. Nelson, and L.R. Musacchio, 2002. Urbanization and warming of Phoenix (Arizona, USA): Impacts, feedbacks, and mitigation. Urban Ecosystems 6(3):183-203. DOI:10.1023/A:1026101528700
- Brazel, A.J., P. Gober, S.J. Lee, S. Grossman-Clarke, J.A. Zehnder, B.C. Hedquist and E. Comparri, 2007. Determinants of changes in the regional urban heat island in metropolitan Phoenix (Arizona, USA) between 1990 and 2004. Climate Research.33(2):171-182. DOI:10.3354/cr033171
- Fan, C., S. Myint, and B. Zheng, 2015. Measuring the spatial arrangement of urban vegetation and its impacts on seasonal surface temperature. Progress in Physical Geography 39(2):199-219. DOI:10.1177/0309133314567583
- Harlan, S.L., J.H. Declet-Barreto, W.L. Stefanov, and D.B. Petitti, 2013. Neighborhood effects on heat deaths: social and environmental predictors of vulnerability in Maricopa County, Arizona. Environmental health perspectives 121(2):197-204. DOI: 10.1289/ehp.1104625
- Iwaniec, D.M., M.J. Davidson, E.M. Cook, M. Berbés-Blázquez and N.B. Grimm, 2020b. Integrating existing climate adaptation planning into future visions: a strategic scenario for the central Arizona–Phoenix region. Landscape and Urban Planning 200:103820. DOI: 10.1016/j.landurbplan.2020.103820.
- Li, X., S.W. Myint, Y. Zhang, C. Galletti, X. Zhang, and B.L. Turner II, 2014. Object-based land-cover classification for metropolitan Phoenix, Arizona, using aerial photography. International Journal of Applied Earth Observations and Geoinformation 33: 321-330. DOI: 10.1016/j.jag.2014.04.018
- Li, X., W. Li, A. Middel, S.L. Harlan, A.J. Brazel, and B.L. Turner II, 2016. Remote sensing of the surface urban heat island and land architecture in Phoenix, Arizona: Combined effects of land composition and configuration and cadastral-demographic-economic factors. Remote Sensing of Environment 174:233-243. DOI: 10.1016/j.rse.2015.12.022.
- Sampson, D.A., E.M. Cook, M.J. Davidson, N.B. Grimm and D.M. Iwaniec, 2020. Simulating alternative sustainable water futures. Sustainability Science 15(4):1199-1210. DOI: 10.1007/s11625-02000820-y.
- Smith, J.P., X. Li, and B.L. Turner I, 2017. Lots for greening: Identification of metropolitan vacant land and its potential use for cooling and agriculture in Phoenix, AZ, USA. Applied Geography 85: 139-151. DOI: 10.1016/j.apgeog.2017.06.005
- Smith, J.P., S. Meerow, and B.L. Turner II, 2020. Planning urban community gardens strategically through multicriteria decision analysis. Urban Forestry & Urban Greening 58. DOI: 10.1016/j.ufug.2020.126897. .